https://cloudjudo.com/assets/img/csca-sample-graph-purchase-...
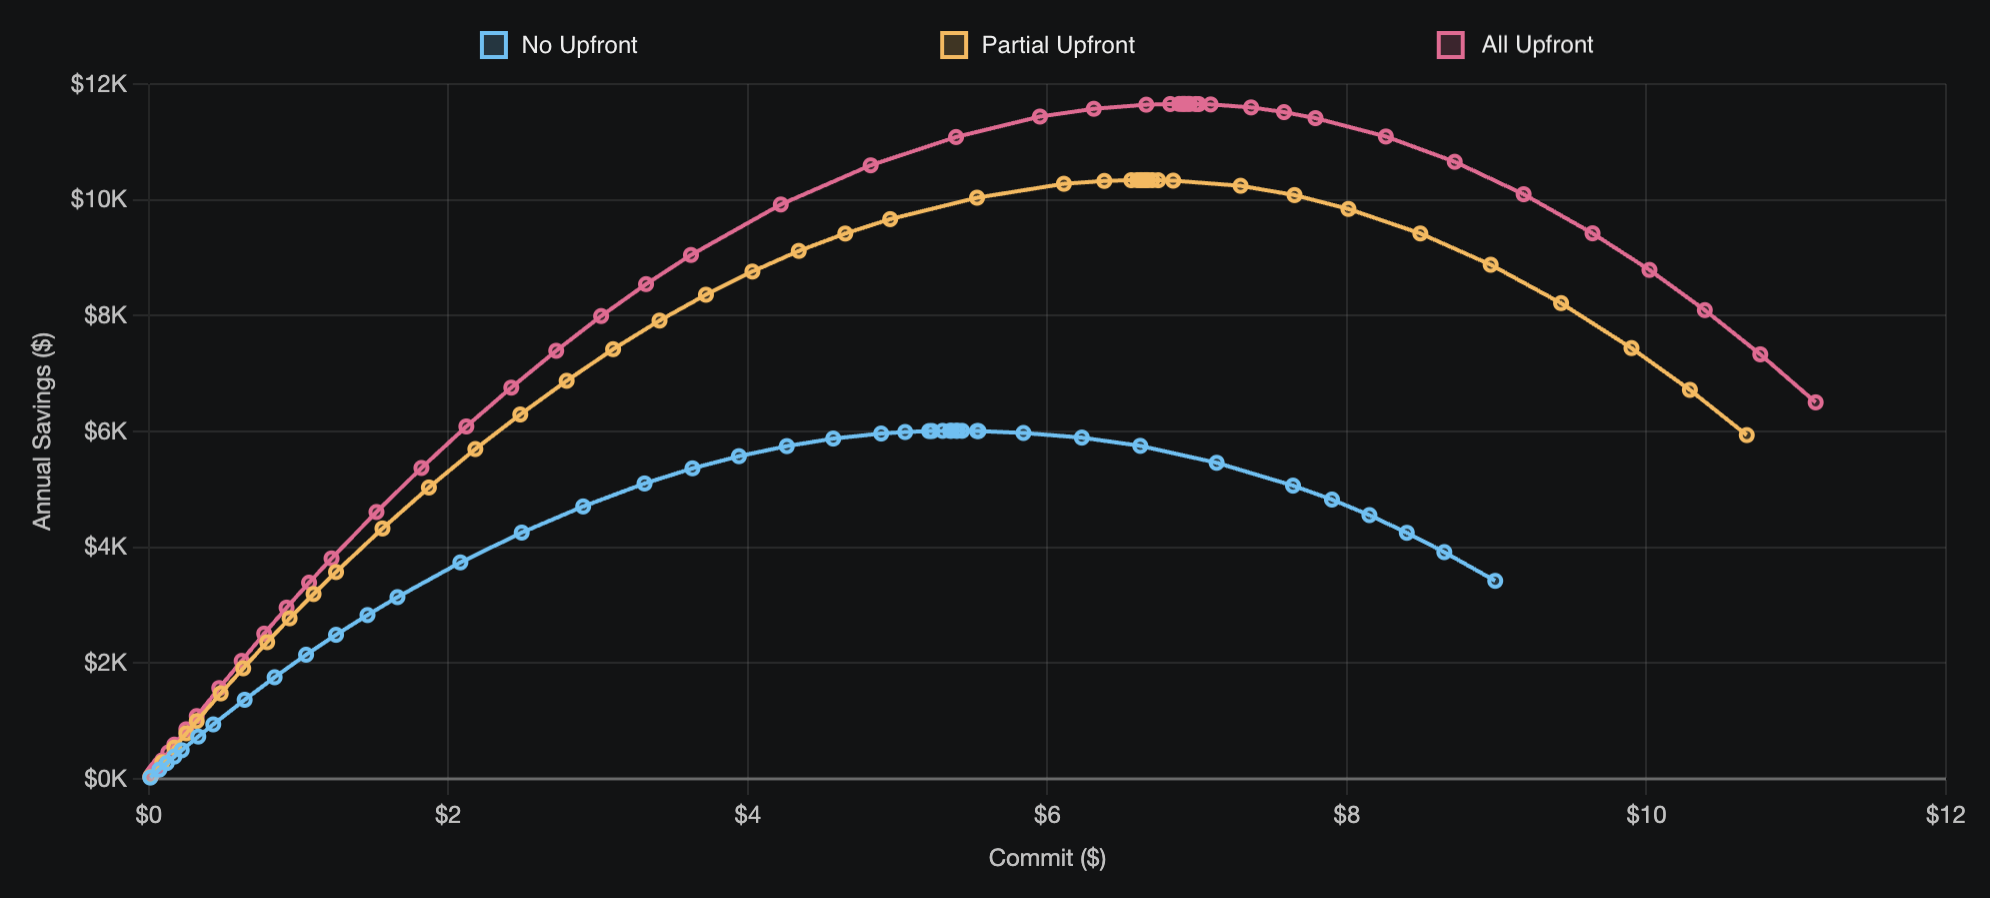
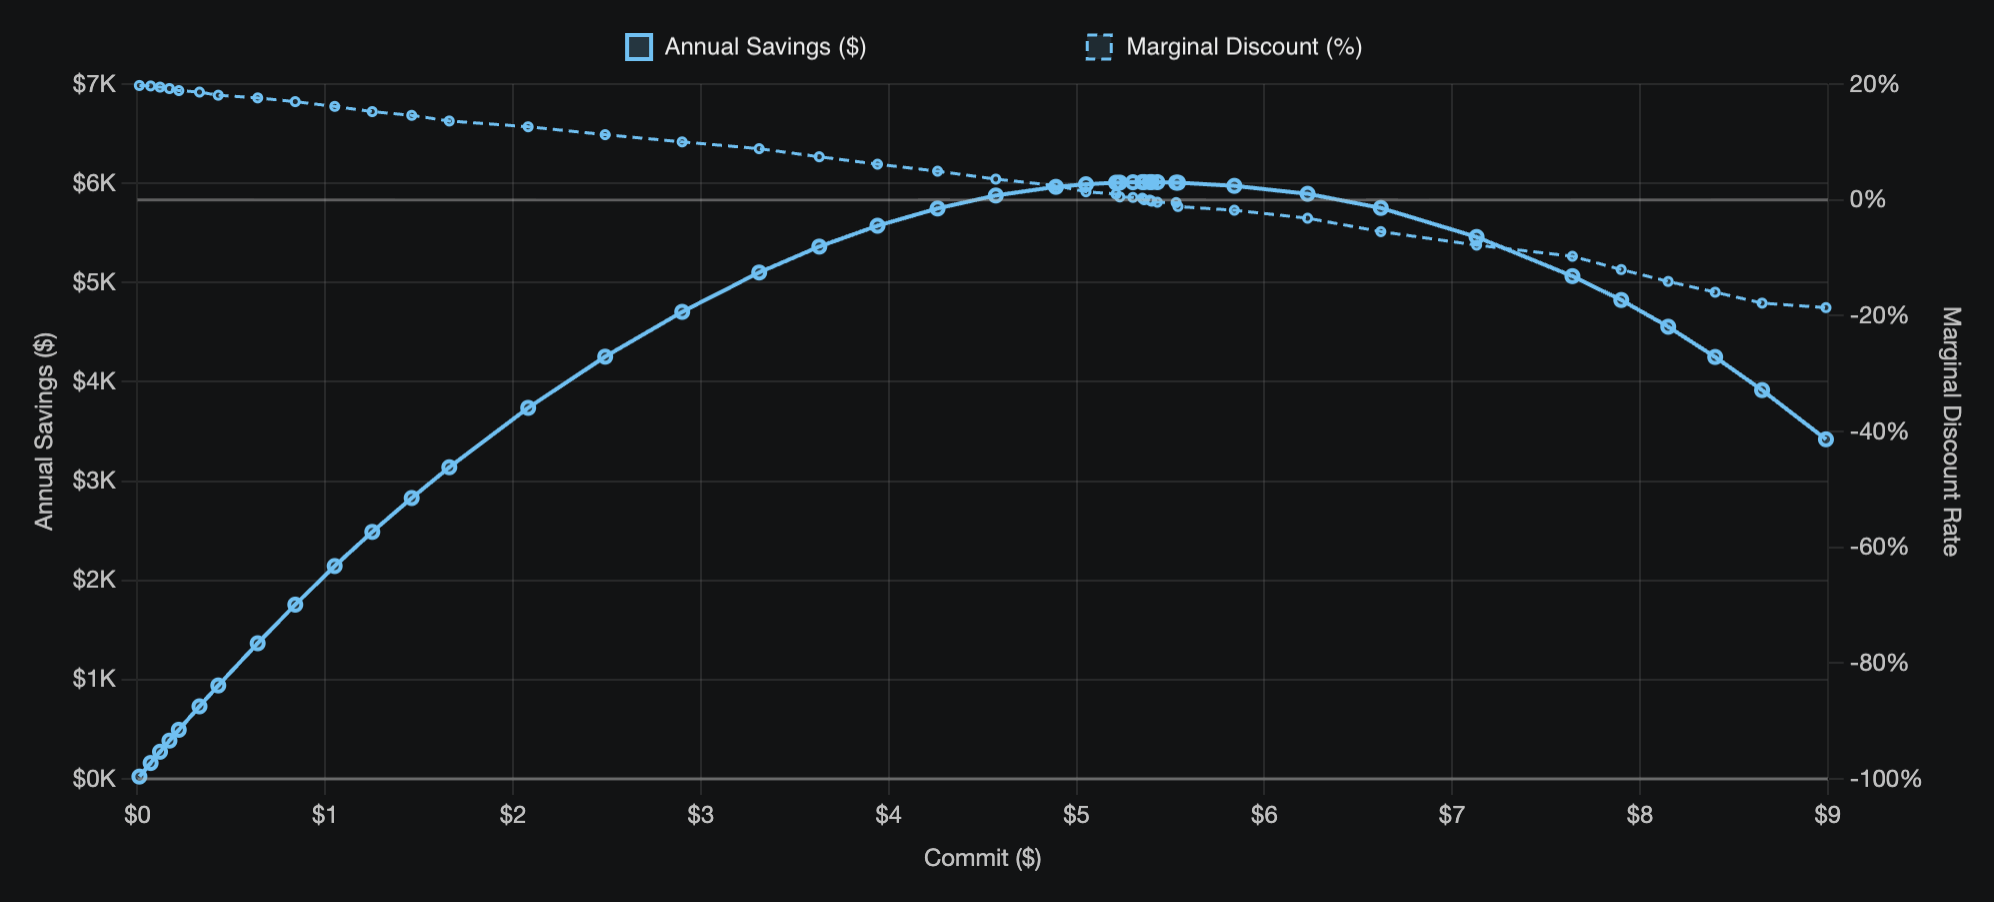
The second image shows a single Compute SP instrument's savings curve alongside its discount curve. Again, the peak of the savings curve is the last point to get positive ROI, and this aligns with the moment that the discount curve crosses 0% and turns negative. The discount curve shows clearly the slope of the savings curve (calculus nerds: discount is the derivative of savings), highlighting the places along the committed dollar dimension where 20% savings becomes 15% savings becomes 10% savings, etc. You want to buy up to the point that your appetite for risk is in equilibrium with the discount received (i.e., you buy as much discount as you can until the risk outweighs the reward).
https://cloudjudo.com/assets/img/csca-sample-graph-marginal-...