Repo: https://github.com/deemkeen/diffwatch
Install:
brew install deemkeen/tap/diffwatch # or go install github.com/deemkeen/diffwatch@latest
Try it quickly:
# start the TUI diffwatch -r . # in another shell: echo "hello" >> demo.txt; sleep 1; echo "world!" >> demo.txt
Why this vs. other watchers? Most watchers tell you that something changed. diffwatch shows what changed, instantly, in a minimal TUI.
Roadmap / looking for feedback: --ignore-from=.gitignore, --word-diff, --context N, export (--record, --save-patch), hooks (--cmd "…")
GIF in the README. Would love feedback, issues, PRs—especially on ignore patterns and diff ergonomics.
> jj autocommits when the working copy changes, and you can manually stage against @-: https://news.ycombinator.com/item?id=44644820
lazyjj is a TUI for jj: https://github.com/Cretezy/lazyjj
Would a live log follow mode for lazyjj solve?
I can't seem to remember the name of the pre-containers tool that creates a virtual build root and traps all the file syscalls. It's not strace.
Easier to trace everything an AI runs by running the agent in a container with limited access to specific filesystem volumes.
eBPF is the fastest way to instrument in Linux AFAIU:
Traceleft: https://github.com/ShiftLeftSecurity/traceleft
Tracee: https://github.com/aquasecurity/tracee
Falco docs > Supported events: https://falco.org/docs/reference/rules/supported-events/
Tetragon: https://github.com/cilium/tetragon
strace could have a --diff-fs-syscall-files option:
strace -p PID -f -F -e trace=file -s 65536 sudo dtrace -n 'vfs::*:entry { printf("%-16s %-6d %s", execname, pid, probefunc); }'
sudo dtrace -n 'vfs:lookup:entry { printf("%-16s %-6d %s", execname, pid, copyinstr(arg1)); }'
  # Must be run as Administrator
  dtrace -n "syscall::NtCreateFile:entry, syscall::NtReadFile:entry, syscall::NtWriteFile:entry { printf(\"%s (%d) - %s\", execname, pid, probefunc); }"
  procmon.exe
  # uncheck everything except "Show File System Activity"
  # Filter > Drop Filtered Events
  # File > Export Configuration...

  # Must be run as Administrator
  procmon.exe /AcceptEula /Quiet /Minimized /LoadConfig C:\Tools\fs-only.pmc /BackingFile C:\Logs\FileSystemTrace.pml
Then with just bpftrace on Linux:
  sudo bpftrace -e 'tracepoint:syscalls:sys_enter_openat { printf("%-6d %-16s %s\n", pid, comm, str(args.filename)); }'

  sudo bpftrace -e 'kprobe:vfs_read, kprobe:vfs_write, kprobe:vfs_open { printf("%-16s %-6d %s\n", comm, pid, probefunc); }'
strace, dtrace, and bpftrace could have a --diff-fs-syscall-files option.
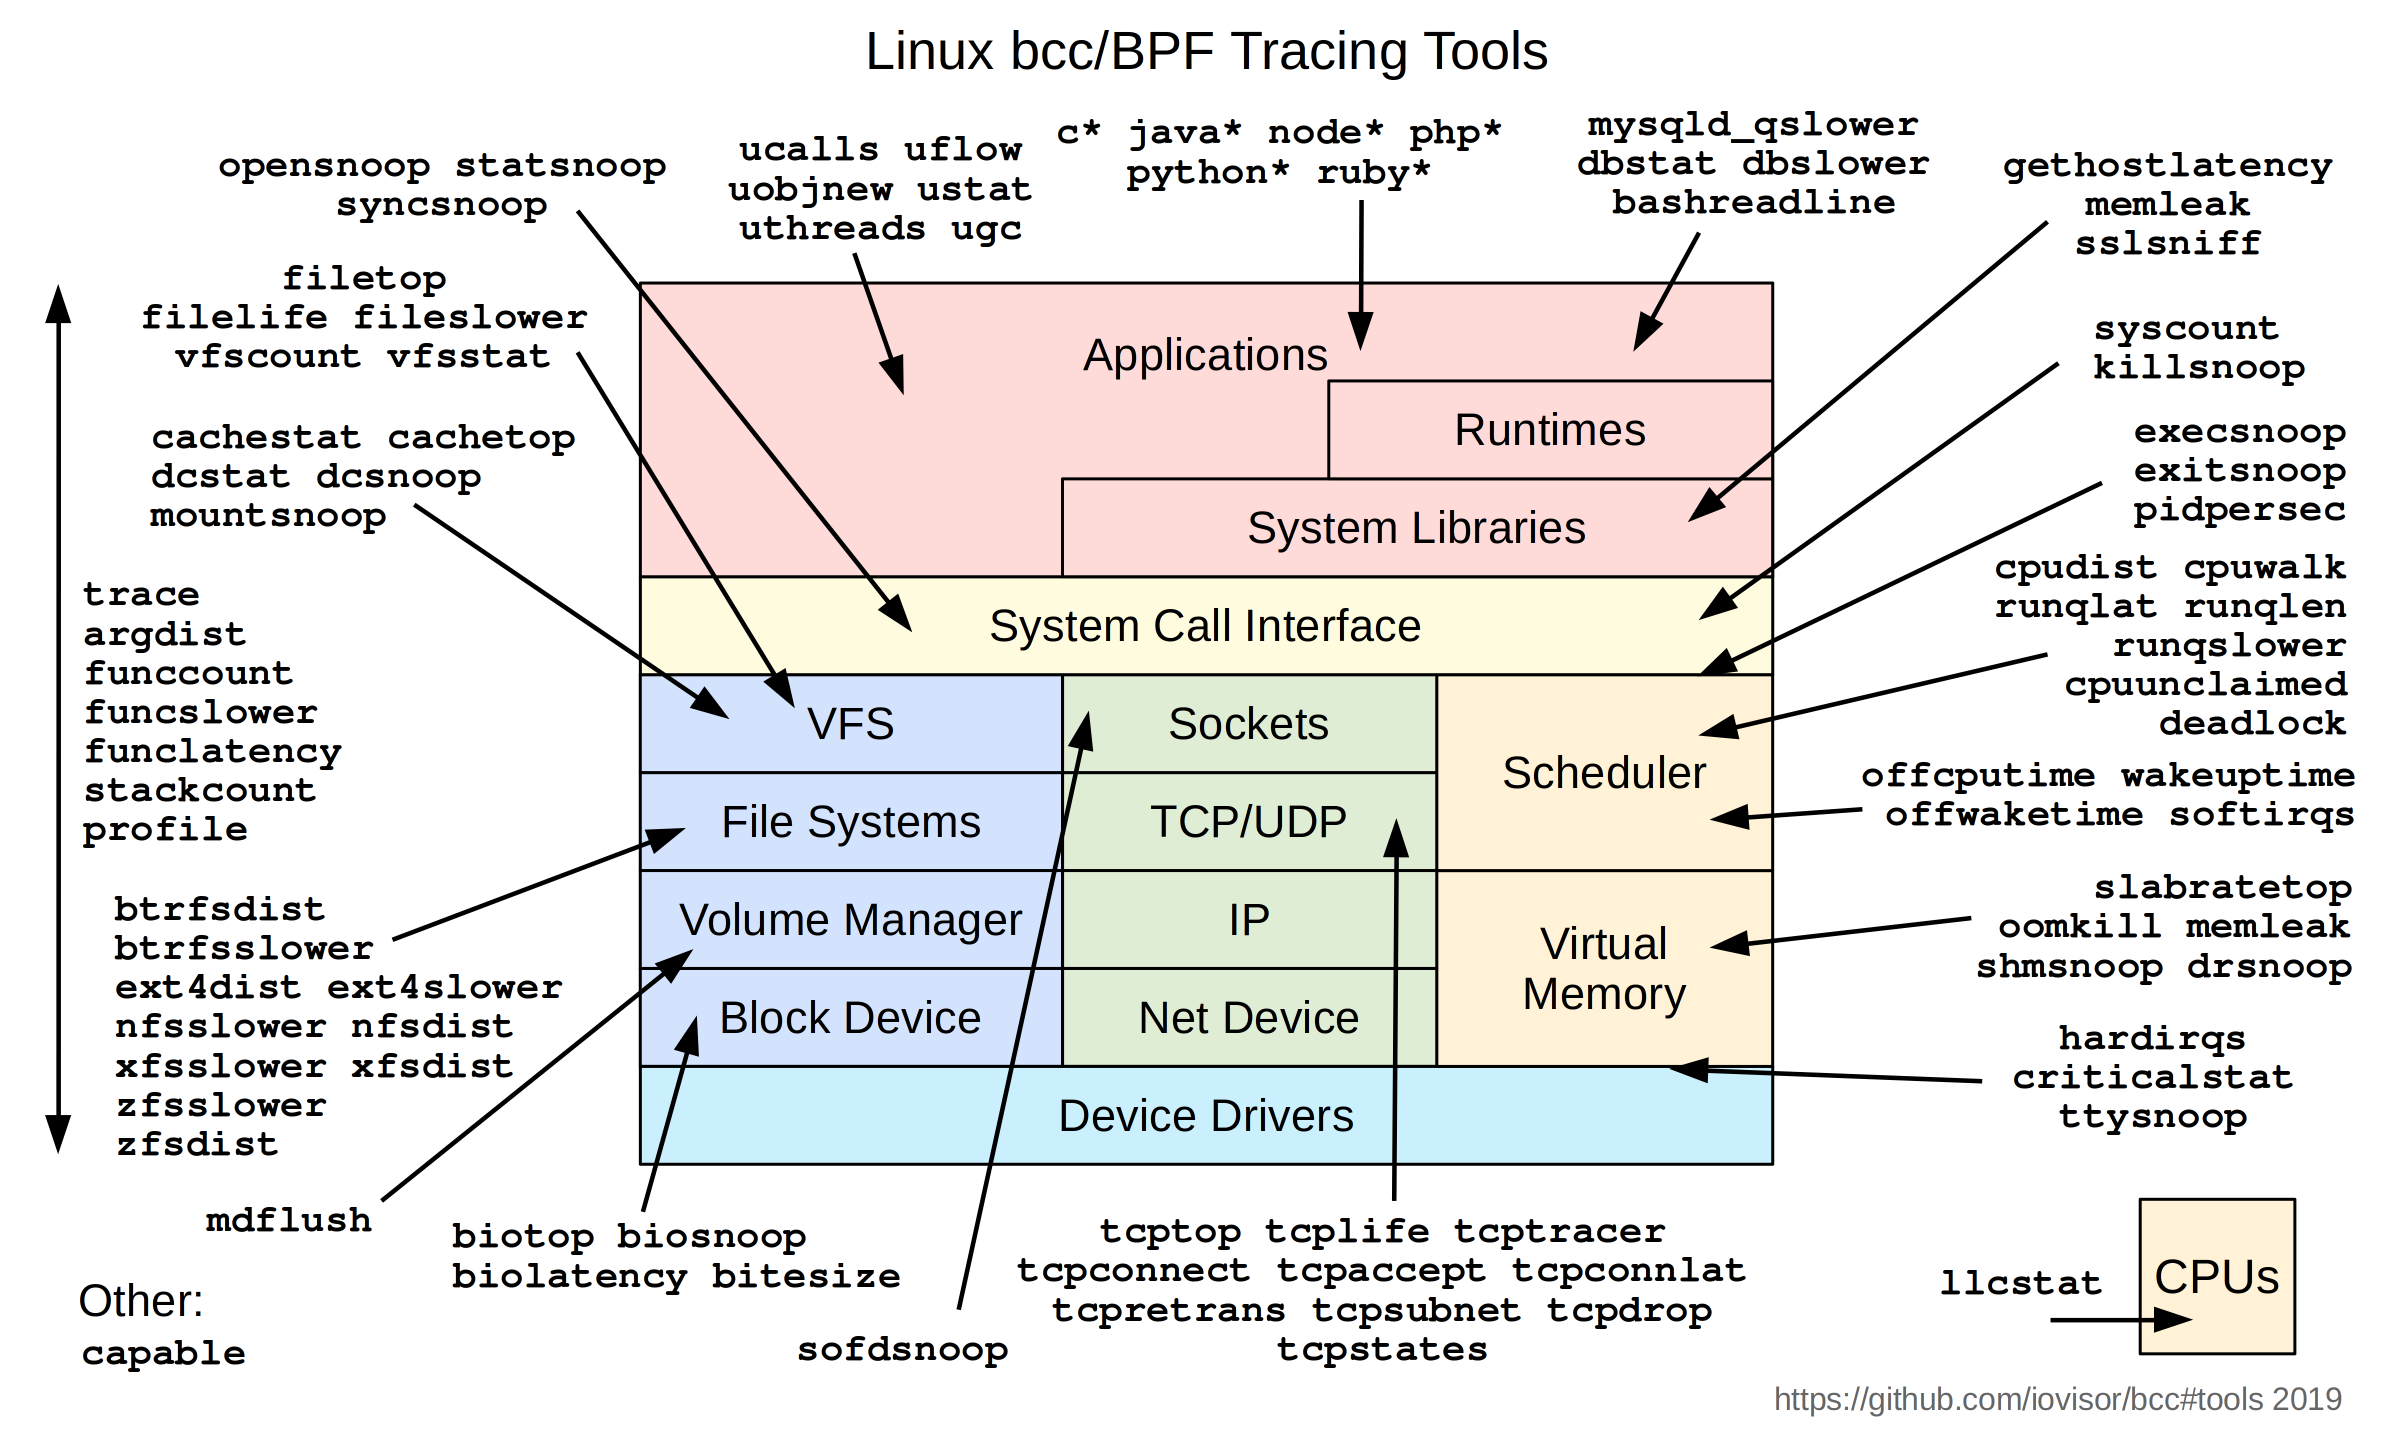
filetop, dirtop, and vfsstat use bpf to trace the VFS layer. [4]
[-1] "Linux bcc/BPF tracing tools" https://www.brendangregg.com/BPF/bcc_tracing_tools_early2019...
[0] iovisor/bcc: https://github.com/iovisor/bcc
[1] "Linux Extended BPF (eBPF) Tracing Tools", Dtrace book: https://www.brendangregg.com/ebpf.html
If running an AI agent in a container --- with devcontainers and e.g. vscode,
Good container policy prevents granting a container the CAP_SYS_ADMIN capability; the least-privileges thing to do is to grant limited capabilities to the container like CAP_BPF and (CAP_PERFMON, CAP_NET_RAW, CAP_SYS_PTRACE) [,3].
[3] https://medium.com/@techdevguides/using-bpftrace-with-limite...
[4] bpfcc-tools manpages: https://manpages.debian.org/unstable/bpfcc-tools/index.html
though ripgrep wins, vscode fails at monitoring large workspaces due to inotify limits too; so some way to parse fs events from bcc and libdtrace with python would be great
prompt 1: Create a python project named idk dbpftrace with a pyproject.toml and a README and sphinx /docs, with bcc and python-dtrace as dependencies to, then in dbpftrace/,
parse pid and descendents' fs syscall events from bcc (ebpf) or python-dtrace (dtrace), depending on which os we're running
Edit:
Prompt 1B: Create a Go package named dbpftrace with a README and docs,
parse pid and descendents' fs syscall events from bpftrace or dtrace stdout, depending on which os we're running
parse pid and descendents' fs syscall events (like bpftrace) using libbpfgo and godtrace
Use either (cilium/ebpf or libbpfgo or gobpf) or (godtrace or (CGO or FFI) bindings to libdtrace) depending on which OS, by default
cilium/ebpf: https://github.com/cilium/ebpf
aquasecurity/libbpfgo https://github.com/aquasecurity/libbpfgo
iovisor/gobpf w/ bcc: https://github.com/iovisor/gobpf
chzyer/godtrace: https://github.com/chzyer/godtrace
oracle/dtrace-utils/tree/devel/libdtrace: https://github.com/oracle/dtrace-utils/tree/devel/libdtrace
From https://news.ycombinator.com/item?id=45755142 re eBPF for WAF:
> awesome-ebpf > Kernel docs, examples, Go libraries: https://github.com/zoidyzoidzoid/awesome-ebpf#go-libraries :
>> Go libraries:
>> cilium/ebpf - Pure-Go library to read, modify and load eBPF programs and attach them to various hooks in the Linux kernel.
>> libbpfgo - eBPF library for Go, powered by libbpf.
>> gobpf - Go bindings for BCC for creating eBPF programs
Where diffwatch is today: it’s a portable directory watcher (fsnotify → inotify/FSEvents/ReadDirectoryChangesW) that coalesces events and renders live unified diffs in a tiny TUI.
What I’m planning based on your suggestions (and others here):
1. Two-tier design
Default (no admin): keep the current directory-watch mode for quick, portable use.
Power mode (attach): diffwatch attach --pid <PID> | --cmd "<…>" to trace a process and its children and feed any touched paths into the same diff UI.
2. Per-OS backends for “attach”
Linux: eBPF/bpftrace when available; fallback to strace -ff -e trace=file for zero extra deps.
macOS: opensnoop / fs_usage (DTrace-based).
Windows: ETW (Kernel File provider) via a tiny helper (e.g., KrabsETW) that streams JSON events.
3. Admin rights caveat
macOS (DTrace) and Windows (ETW kernel) typically require admin. I’ll keep the default dir-watch mode as the “no-admin” path, and document the elevated-rights requirement clearly for “attach”.
4. Normalized event stream
All backends emit a common JSON line: {"ts": "...", "pid": 1234, "op": "create|write|rename|unlink|close", "path": "..."} Then a short stability window (debounce + retry on transient ENOENT) before reading to diff.
5. Scalability & ergonomics
Handle editor/atomic-save tempfiles gracefully.
Respect .gitignore and add --exclude/--include globs.
Guardrails for watch count limits; skip non-regular files; optional --record (NDJSON) and --save-patch.
6. Containers / agents
Nice follow-on: diffwatch attach --cmd ... inside a container (or attach by PID in the container namespace) to confine the blast radius for agent runs.
Ask: I’d love help and pointers to minimal tracer scripts:
A small bpftrace/DTrace snippet that reliably captures opens/writes/renames for a PID(+children).
A tiny Windows ETW consumer example focused on File I/O, filtered by PID, emitting JSON.
Repo: https://github.com/deemkeen/diffwatch I’ll open issues for:
“Attach mode” backends (Linux/macOS/Windows)
.gitignore/globs
Event coalescing + transient ENOENT handling
JSON recording / patch export
If you or anyone wants to collaborate, I’ll tag them good first issue / help wanted and am happy to review PRs quickly. Thanks again for the nudge to go beyond plain FS events — the PID/container “attach” mode should make agent debugging much more robust.
Does this command also track renames?
sudo dtrace -n 'vfs::*:entry { printf("%-16s %-6d %s", execname, pid, probefunc); }'
Actually, re: Dtrace on MacOS with SIP and apparently without sufficient symbols installed to trace kernel syscalls these days: https://news.ycombinator.com/item?id=38909715
It looks like there's a utility called dtruss which wraps Dtrace on OSX: https://www.google.com/search?q=dtruss
"Misadventures in DTrace: how to debug the macOS kernel" (2025) https://jade.fyi/blog/misadventures-in-dtrace/ :
> My advice, and what I actually did, is to put macOS in a UTM.app VM with nothing of value in it, disable SIP in the VM, and do all further testing in there.
> Once inside a VM with SIP disabled (or with dtrace enabled as a fine-grained policy), DTrace works. dtruss gives some output like the following:
FWIU it is possible to trace Linux containers on Mac OS with e.g. cilium, only if the Linux containers are hosted in a Linux VM.